Second Quarter, 2016
Dear Client,
We are pleased to present our second quarterly newsletter for 2016. We hope you find the information useful and helpful in your investment considerations. In this letter, we provide an update on the economy, financial markets, and management of your portfolio in the current environment. We are committed to communicate with you regularly to keep you updated on the financial markets and our portfolio strategies.
The following topics will be covered:
- The U.S. Economic Outlook
- Global Economic Outlook
- U.S. and Global Monetary Policy
- Financial Markets
- Portfolio Strategy
U.S. Economy:
The U.S. economy continued to shrug off fears of a recession. 2016 first quarter data showed consistent job gains, wage growth, and resilient consumer spending. In March, U.S. employers added a seasonally adjusted 215,000 jobs, with a quarterly growth average of 209,000. The labor force participation rate improved to 63%, the fourth consecutive increase, and average hourly earnings increased to $25.43, a 2.3% annual increase. Despite payroll strength, the unemployment rate ticked up slightly from 4.9% to 5.0%
.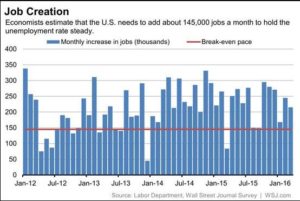
As shown in the chart above, economists estimate that the number of jobs required to hold the unemployment rate steady is about 145,000.
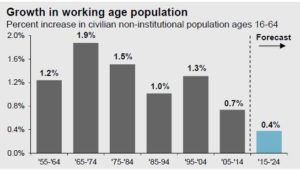
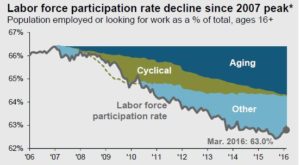
As the Baby Boomer population is moving towards retirement, the U.S. working age population is now growing at a slower pace. The ageing of the labor force partly explains the slowdown in the labor participation rate, as well as the slower rate of economic growth from past recoveries. The two charts below illustrate this phenomenon.
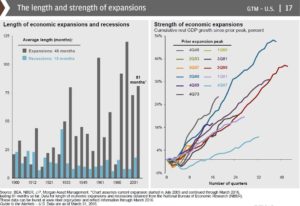
The post-2008 crash economic recovery is now in its seventh year. There are concerns that this cycle of economic expansion is “long in the tooth.” However, as the chart below shows, such a long recovery period is not unprecedented. Moreover, the strength and pace of recovery has been unusually slow, compared to past recoveries. This indicates that the expansion could yet continue and there are few signs of a recession in the horizon.
Global Economy:
The European economy continues to grow at a slow and steady pace. The Purchasing Managers Index, which reflects industrial trends, is in strong positive territory. Unemployment in the EU continues to go down and has reduced from 10.3% in February 2016 from 10.5% in November. The Central Banks’ NIRP (Negative Interest Rate Policy) seems to be having an effect as credit off-take has improved significantly.
Japan’s economic picture is less positive. Growth is anemic and corporate confidence has waned. Japan’s Central Bank may be running out of options to boost the economy and all its massive stimulus packages have had limited impact.
The good news is that concerns over the Chinese economy have mitigated. The Chinese government came out with a declared intent to support growth with strong fiscal and monetary stimulus measures as necessary. The PPI has improved, though it is still in contracting territory. The Chinese economy has to negotiate a difficult path that promotes domestic consumption and curtails excess industrial capacity. It is likely to proceed slowly on this path, which may lower risks to the global economy from a sharp Chinese slowdown.
Emerging Markets remain a mixed picture with wide country variations. Brazil is in the middle of a political crisis. India is showing strong economic growth, however, it might take a while for the debt ridden corporate sector to grow profits substantially.
U.S. & Global Monetary Policy:
As we discussed last quarter, the Federal Reserve (Fed) held off on raising interest rates until March. It is likely that we are going to see one or two possible interest rate increases in 2016. While the Fed cited global growth concerns, we believe that currency valuations are a major factor in the Fed’s caution. The world economy is in an environment of a silent currency war. Europe and Japan are trying to devalue their currencies to export their way to higher economic growth. Many Central Banks already have a NIRP policy in place.
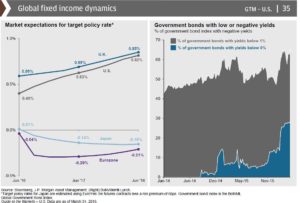
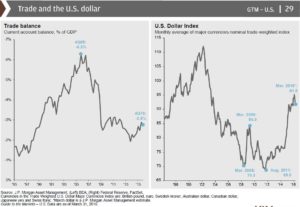
As the charts above show, approximately 65% of global sovereign bonds are paying less than 1% yield, and about 30% have negative yield. As the above left chart shows, the yield for Europe and Japan is likely to remain negative for the foreseeable future. The U.S. Dollar has considerably strengthened over the past two years and is causing U.S. exports to suffer. A further increase in the U.S. Dollar value could have a dampening effect on the U.S. economy. As the U.S. interest rate increases, we could see more fund flows in search of yield, thus pushing the Dollar in stronger territory. It is our opinion that this was a major concern that stayed Fed Chairperson Janet Yellen’s hand.
Financial Markets:
January 2016 represented the worst start to the year in over a century for US equity markets. Volatility spiked during Q1. The S&P 500 moved in excess of +/- 1% on 43% of market days. That’s about double the average since 1933.
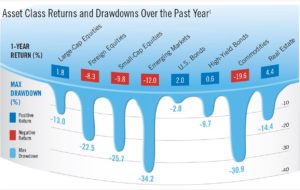
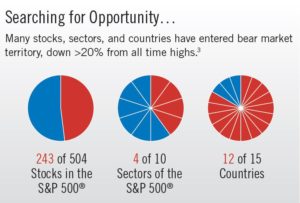
The graph above shows just how volatile markets were over the past year. From January to mid-February 2016, the broad equity market lost more than 10% while many sectors, such as healthcare, energy, and small cap, lost approximately 15%. Since then, markets have bounced back, but not all sectors have come back into positive territory. Nearly half the stocks in the S&P 500 and half the broad sectors (Energy, Technology, Healthcare and Telecom) were more than 20% below their all time high at the end of Q1. This is also true of most major foreign markets such as Japan, UK, Canada and Switzerland. Small Cap stocks, particularly small cap growth, are negative for the year.
For Q1 overall, S&P 500 was up by 0.77%, while the NASDAQ Composite was down by
-2.75%. Russell 2000, a small cap index, lost -1.92%. The MSCI EAFE (Developed World ex-USA) index lost -2.6%, while the MSCI EM (Emerging Markets) was up by 6.4%.
Due to large variance of returns and deep drawdowns in certain sectors, well-diversified portfolios, such as the ones we endeavor to maintain for our clients, lagged the major benchmarks. However, short term aberrations aside, in the longer time frame a diversified asset allocation tends to outperform.
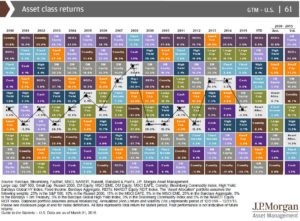
The chart below shows rankings of different asset classes based on their performance. As one can see, a diversified asset allocated portfolio always is in the median range of returns, though individual asset classes can fluctuate from very high returns to large negative returns. In the long run, the median steady returns may provide higher returns with less volatility.
Portfolio Strategy (For Managed Fee-Based Accounts):
Over the last quarter, we reduced our holdings in some sectors of the equity market and eliminated almost all energy positions. We also reduced our exposure to small cap growth and tilted more towards value. We bought a tactical fund that focuses on market technicals in an attempt to avoid large drawdowns. Also, we added alternative funds that focus on absolute returns and have excellent track records.
In the past few quarters, most mutual funds have struggled to keep up with the market or beat their benchmarks. This is due to a number of factors – an increase in market volatility, massive rotation in stock performance, and narrower markets. Only a few stocks, mainly larger cap, have gone up substantially which pushes up the index. However, since most mutual funds tend to be much less concentrated, they could not get the full upside benefit even when their stock picks were correct. We believe this is a longer term change in the market. Accordingly, we have moved more towards ETFs and mutual funds with rule-based characteristics. These ETFs and ETF-like mutual funds have performed better in this environment.
Event Risks
Geopolitical risks have receded somewhat in the latest quarter. Recently, ISIS has taken losses and lost territory. The war in Yemen seems to have stopped following ceasefire stocks. However, the state of affairs in the Middle East continues to remain bleak. While there seems to be no immediate threat to petroleum supplies from these regions, that could change rapidly if matters substantially worsen.
_________________________________________________________________________
If you are worried about market volatility continuing, please contact us to discuss the pros and cons of allocating some funds to annuities with guaranteed income and/or death benefit riders, or income generating investments with limited exposure to the equity markets. Such products are sold by prospectus only and all investors must meet suitability requirements.
Thank you for choosing Prescott Tax & Wealth Management as your financial partner. We encourage you to take advantage of our financial planning capabilities, such as a comprehensive financial plan that may provide you peace of mind over questions such as “Am I fully prepared for retirement?”, “Will I be able to fulfil my life goals?”, and “Is my estate planning adequate?”
Also, we have the capability of answering questions regarding Social Security and we can help you decide how to best utilize your Social Security Benefits. Choosing the right time and method in filing for Social Security could mean a difference of hundreds of thousands of dollars during your lifetime.
If we can be of further service to you or your loved ones, please do not hesitate to contact us at (949) 248- 9815 or by email at [email protected]
Best Regards,
Peter Prescott, CPA, PFS, PFP
Atish Bagrodia, CFA, CAIA
The opinions expressed are those of Prescott Tax and Wealth Management as of January 8th 2016 and are subject to change. There is no guarantee that the forecasts made will come to pass. This material does not constitute investment advice and is not intended as an endorsement of any specific investment. Investment involves risk. Investing in foreign markets involves currency and political risks. Information and opinions are derived from proprietary and non-proprietary sources. Please note that investing in the stock market involves risk and no strategy can mitigate the risk completely. S&P 500 is a registered trademark of The McGraw-Hill Companies, Inc.
Peter Prescott is a Registered principal offering securities and advisory services through Independent Financial Group LLC, a registered broker-dealer and investment advisor. Member FINRA & SIPC. Prescott Tax & Wealth Management and IFG are unaffiliated entities.
1) Historical returns for the various asset classes are based on performance numbers provided by Ibbotson Associates in the Stocks, Bonds, and Inflation (SBBI) 2001 Yearbook (annual update work by Roger G. Ibbotson and Rex A. Sinquefield). Domestic stocks are represented by the S&P 500® Index, bonds are represented by U.S. intermediate-term government bonds, and short-term assets are based on the 30-day U.S. Treasury bill. Foreign equities are represented by the Morgan Stanley Capital International Europe, Australasia, Far East Index for the period from 1970 to the last calendar year. Foreign equities prior to 1970 are represented by the S&P 500® Index.


